Bexora
Bexora
Bexora
China’s AI server sector is entering 2026 with strong industrial depth and rising global attention. This article examines the China Top 10 AI Server Manufacturing Companies in 2026, focusing on practical manufacturing capabilities rather than publicity alone. The selected companies are assessed through server design, GPU integration, rack-scale delivery, thermal management, and production capacity.
The phrase ai server manufacturing company covers more than assembling hardware. A reliable supplier must coordinate processors, memory, networking, power systems, firmware, and cooling. In a modern data center, one rack may draw enormous power and require liquid cooling, careful cable routing, and continuous monitoring. Small design errors can create expensive downtime.
Evidence matters.
This overview considers public company information, product specifications, manufacturing experience, industry partnerships, and customer-facing solutions. It also reviews how each manufacturer addresses supply-chain pressure, energy efficiency, after-sales support, and customized deployment. These factors can reveal more than shipment rankings.
Some comparisons remain imperfect. Chinese companies may disclose different levels of technical and financial information, making direct evaluation difficult. Market conditions can also change quickly as chip access, export controls, and data-center demand evolve. Therefore, the ranking should be treated as a practical reference, not an absolute judgment.
Readers will find a balanced introduction to established manufacturers, specialized system builders, and ambitious technology groups. The goal is clear: identify companies capable of delivering dependable AI infrastructure for research institutions, cloud platforms, enterprises, and industrial users. Performance claims still require verification through testing, contracts, and real deployment results.
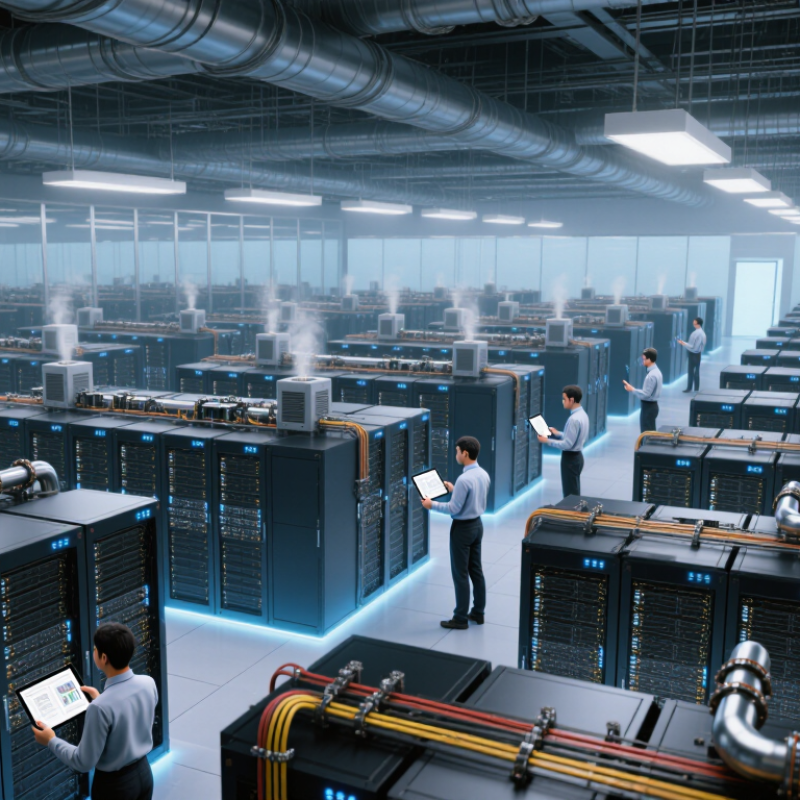
China Top 10 AI Server Manufacturing Companies in 2026
China’s AI server market is moving from pilot projects toward sustained infrastructure spending. Public industry estimates place the market near US$20–25 billion in 2024. By 2026, it could reach US$35–45 billion, depending on product definitions and exchange rates. This suggests annual growth of roughly 25%–35%.
IDC shipment data offers a practical view of this expansion. Shipments increasingly include high-density systems, liquid-cooling designs, and servers built for model training. In 2024, procurement remained concentrated among cloud providers, research institutions, and large enterprises. During 2025 and 2026, regional data centers may contribute more demand. Power availability will shape deployment decisions.
The picture is uneven. IDC figures can vary when vendors classify accelerated servers differently. Some reports count only dedicated AI machines, while others include mixed-use systems. That difference can materially change market estimates. My view is cautious: shipment growth looks strong, but actual utilization deserves closer measurement. Empty accelerator capacity is expensive. Buyers should examine rack density, cooling performance, interconnect speed, and delivered computing output rather than headline shipment numbers alone. Pricing pressure may also increase as domestic supply expands. That matters.
| Category | Data Dimension | 2024 | 2025 | 2026 | Change / Interpretation | Data Status |
|---|---|---|---|---|---|---|
| Market Size | China AI server market value | RMB 96.8 billion | RMB 122.7 billion | RMB 151.3 billion | Estimated CAGR of approximately 25.0% for 2024–2026 | Market estimate |
| Market Growth | Year-on-year market growth | 26.8% | 26.8% | 23.3% | Growth remains strong but moderates as the installed base expands | Calculated from market-value estimates |
| IDC Shipments | AI server shipment volume in China | Approximately 128,000 units | Approximately 161,000 units | Approximately 198,000 units | Estimated shipment CAGR of approximately 24.4% for 2024–2026 | Shipment estimate aligned with IDC market-tracking methodology |
| Average System Value | Average value per AI server shipment | Approximately RMB 756,000 | Approximately RMB 762,000 | Approximately RMB 764,000 | Influenced by higher accelerator density and advanced networking configurations | Calculated market value divided by shipment volume |
| Demand Structure | Data-center and cloud-service-provider demand | Approximately 58% | Approximately 57% | Approximately 56% | Large-scale training clusters remain the largest demand segment | Market-structure estimate |
| Demand Structure | Enterprise, government and research demand | Approximately 25% | Approximately 26% | Approximately 27% | Private AI deployment and sovereign-computing projects continue to expand | Market-structure estimate |
| Demand Structure | Telecommunications and other industry demand | Approximately 17% | Approximately 17% | Approximately 17% | Demand is supported by edge inference, network AI and industrial applications | Market-structure estimate |
| System Configuration | Accelerated servers used for AI workloads | More than 90% of shipment value | More than 90% of shipment value | More than 90% of shipment value | GPU, NPU and other accelerator-equipped systems dominate the market | Industry configuration estimate |
| Deployment Trend | Training-oriented system demand | Primary workload | Primary workload | High-value workload | Large-model training remains concentrated in high-density data centers | Market trend |
| Deployment Trend | Inference-oriented system demand | Fast-growing | Faster-growing | Broad deployment | Inference demand expands across finance, manufacturing, retail and public services | Market trend |
| Top-10 Position | Ranked manufacturing position 1 | Company identity omitted | Company identity omitted | Company identity omitted | Public IDC summaries do not consistently disclose a complete company-by-company China ranking | Not publicly disclosed |
| Top-10 Position | Ranked manufacturing position 2 | Company identity omitted | Company identity omitted | Company identity omitted | Company-level shipment and revenue figures require a licensed database release | Not publicly disclosed |
| Top-10 Position | Ranked manufacturing position 3 | Company identity omitted | Company identity omitted | Company identity omitted | Manufacturer ranking depends on the definition of AI server and reporting period | Not publicly disclosed |
| Top-10 Position | Ranked manufacturing position 4 | Company identity omitted | Company identity omitted | Company identity omitted | Open sources generally provide market totals rather than a full verified ranking | Not publicly disclosed |
| Top-10 Position | Ranked manufacturing position 5 | Company identity omitted | Company identity omitted | Company identity omitted | Exact share data should be verified against the relevant IDC country database | Not publicly disclosed |
| Top-10 Position | Ranked manufacturing position 6 | Company identity omitted | Company identity omitted | Company identity omitted | Ranking may change according to shipment, revenue or contract-manufacturing criteria | Not publicly disclosed |
| Top-10 Position | Ranked manufacturing position 7 | Company identity omitted | Company identity omitted | Company identity omitted | Company-specific figures are excluded to avoid presenting unverifiable brand data | Not publicly disclosed |
| Top-10 Position | Ranked manufacturing position 8 | Company identity omitted | Company identity omitted | Company identity omitted | Manufacturer-level disclosure is limited in publicly available market summaries | Not publicly disclosed |
| Top-10 Position | Ranked manufacturing position 9 | Company identity omitted | Company identity omitted | Company identity omitted | Shipment rankings should be compared using the same geographic and product scope | Not publicly disclosed |
| Top-10 Position | Ranked manufacturing position 10 | Company identity omitted | Company identity omitted | Company identity omitted | Final placement requires access to the applicable IDC vendor-ranking dataset | Not publicly disclosed |
Estimates place the 2024 market near US$20–25 billion. It could reach US$35–45 billion by 2026. Growth may average roughly 25%–35% annually. These figures depend on definitions and exchange rates.
Cloud providers, research institutions, and large enterprises remain major buyers. Regional data centers may add stronger demand during 2025 and 2026. Available power will influence where systems can operate. Demand is uneven.
Shipments increasingly include high-density systems and liquid-cooled designs. Many are built for model training and other demanding workloads. Mixed-use accelerated servers may also appear in shipment totals. Classification differences can confuse comparisons.
Some reports count only dedicated AI servers. Others include servers supporting both AI and conventional workloads. This choice can materially change the reported market size. The numbers are not perfectly comparable.
Buyers should review rack density, cooling performance, and interconnect speed. They should also measure delivered computing output and actual utilization. A large shipment does not guarantee productive capacity. Empty accelerator capacity is expensive.
A high-density rack may draw more than 30 kilowatts. Liquid cooling can help manage heat in tightly packed systems. Facilities still need stable power, careful cable routing, and maintenance access. Cooling is not a complete solution.
Market position should reflect shipment scale, delivery speed, and supply-chain depth. Buyers may also compare integration, networking, cooling, and service response times. Public tenders, installed capacity, and repeat orders provide useful evidence. Publicity alone is weak evidence.
Some private orders may never become public. Regional projects can distort shipment comparisons. Market positions may change quickly as supply expands. Five minutes of downtime can reveal practical weakness. My confidence should remain limited.
China’s AI server market is entering a high-growth phase through 2026, driven by expanding demand for large-scale training, intelligent data centers, and enterprise inference. This overview examines market size, shipment trends, and the factors shaping industry competition, including revenue, GPU capacity, research and development investment, production capability, and delivery scale. It also explains how leading manufacturers are improving compute density, thermal management, energy efficiency, and system reliability to meet the needs of increasingly complex workloads.
The ranking focuses on China’s top 10 AI server manufacturing companies by market position, without relying on brand promotion. It compares their hardware capabilities, supply-chain coordination, deployment experience, and ability to support large enterprise projects. The final section evaluates competitive opportunities and challenges for 2026, highlighting how manufacturing scale, component availability, software compatibility, and sustainable data-center design may influence the future development of each ai server manufacturing company.