Bexora
Bexora
Bexora

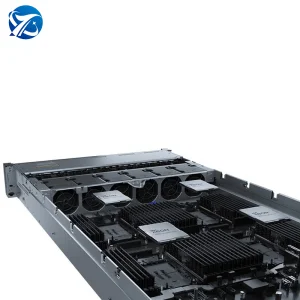
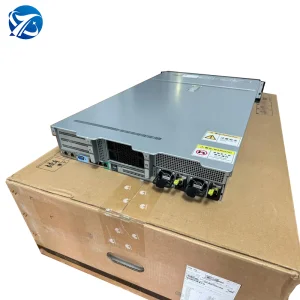
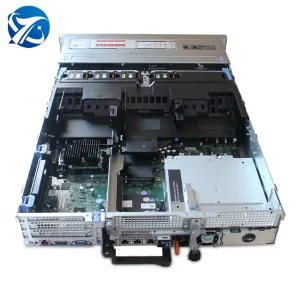
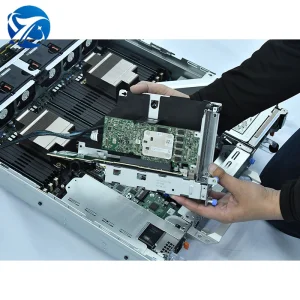
Bexora AI Systems (China) Co., Ltd. is a leading, specialized AI GPU server and high-performance computing (HPC) infrastructure manufacturer based in China. Founded in 2016, we design, develop, and export telemetry-enabled, carrier-grade compute systems tailored for artificial intelligence training, deep learning inference (including optimization for models such as DeepSeek), cloud storage architecture, and massive web cloud deployments. Our hardware is custom-engineered to seamlessly interface with modern server monitoring tools, ensuring maximum up-time and granular sensor reporting at scale.
In the modern age of hyperscale virtualization and complex neural network training, the hardware platform must do more than compute; it must communicate its vital metrics in real-time. As global organizations scale up their server fleets with dense processors—such as Intel Xeon 6th Generation platforms and high-wattage GPU nodes—monitoring thermal boundaries, current draws, memory latency, and bus utilization becomes an absolute priority. As a premier exporter, Bexora bridges the hardware-software gap by manufacturing nodes pre-optimized for popular server monitoring tools like Zabbix, Prometheus, Datadog, Grafana, and out-of-band management platforms.
Without robust hardware-integrated monitoring, data centers risk catastrophic service degradation due to undetected hardware failures, memory leakages, or silent data corruption. High-performance networks require persistent, low-overhead monitoring pathways to extract diagnostic telemetry from RAID cards, network interface controllers (NICs), PCIe storage interfaces, and power distribution units (PDUs).
By using dedicated Baseboard Management Controllers (BMC) compliant with IPMI 2.0 and Redfish standards, our systems expose detailed operational telemetry. Monitoring teams can inspect critical parameters—fan rotational speeds, step-down voltage regulators, CPU junction temperatures—completely independent of the host operating system state.
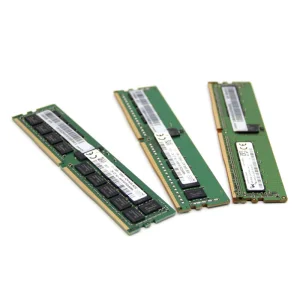
In cooperation with advanced monitoring agents, our hardware exports SMART telemetry from PCIe NVMe drives (such as the Samsung PM9A3 series) and error-correcting codes (ECC) from high-speed DDR4/DDR5 memories. This raw data feeds predictive AI models to swap components before they trigger a system-wide crash during high-cost LLM training.
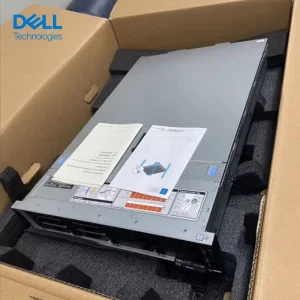
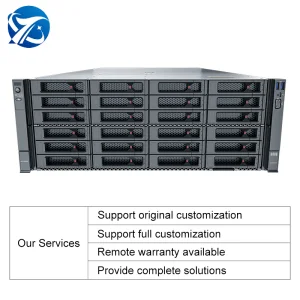
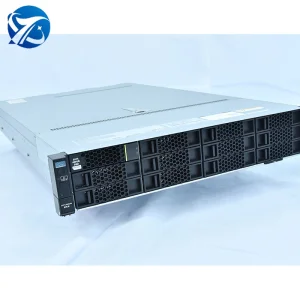
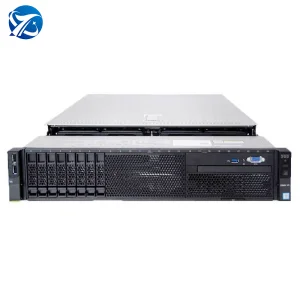
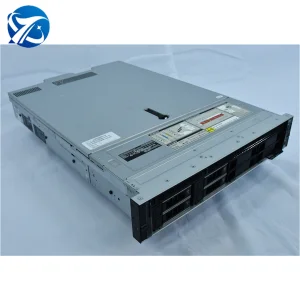
Whether managing high-density xFusion servers, enterprise Dell PowerEdge nodes, or our own custom GPU-optimized clusters, standardized system API integrations ensure unified visibility. This allows operators to consolidate heterogeneous server footprints into single-pane-of-glass orchestration dashboards.
To maximize compatibility with enterprise server monitoring tools, our systems expose a comprehensive suite of hardware sensors. The table below outlines the primary monitored categories, baseline transmission protocols, and standard integration options.
| Hardware Subsystem | Monitored Parameters | Standard Protocols | Integration Options |
|---|---|---|---|
| Processor (CPU/GPU) | Core temperatures, power limit thresholds, clock throttling states, load percentages. | Redfish, IPMI, Intel Node Manager | Prometheus Node Exporter, Telegraf Agent |
| Memory (DDR4/DDR5 RDIMM) | ECC single-bit error rates, multi-bit failure warnings, operating frequency, voltage drop. | SMBus, BMC telemetry logs | OS Event log collectors, Datadog Agent |
| Storage Array (NVMe/SATA SSD) | SMART health status, write endurance remaining, read/write IOPS, media degradation. | NVMe-MI, SNMP traps | OpenTelemetry collectors, Nagios NRPE |
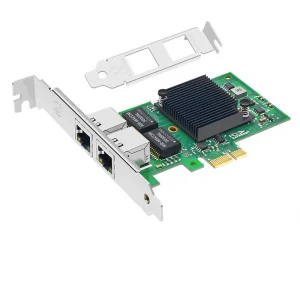
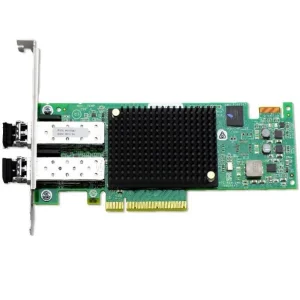
| PCIe & Network (HBA/NICs) | Fibre Channel link speeds, packet drop counters, transceiver optical power, PCIe error counters. | MCTP over PCIe, Netflow, SNMP | Zabbix Network monitoring templates |
| Power Distribution (PDU/PSU) | Total power draw (Watts), voltage phase state, input current quality, efficiency curves. | PMBus, BMC console redirection | Grafana dashboards, PRTG Network Monitor |
The convergence of edge AI processing and high-density liquid cooling setups has forced a paradigm shift in how servers are monitored. In critical zones like North America, Europe, and the Middle East, traditional polling methods are rapidly being replaced by real-time streaming telemetry. Instead of using periodic SNMP queries that put unnecessary load on the CPU, modern monitoring tools leverage event-driven webhooks. When an operational metric drifts past normal thresholds (such as high inlet temperature or a drop in a cooling pump’s flow rate), the server instantly triggers an active webhook directly to IT command centers.
Moreover, local compliance requirements (such as the EU's Energy Efficiency Directive or localized carbon footprint reporting in various data hubs) mandate strict monitoring of power usage effectiveness (PUE). By integrating precise voltage and amperage sensors directly onto the motherboard of compute platforms like the FusionServer 2488H V7 or Dell PowerEdge R760XS, Bexora ensures operators can compute real-time IT equipment energy consumption with sub-watt accuracy.
Deployment at remote cellular stations and regional edge points requires headless operation. Our servers are built with resilient out-of-band communication chips, enabling centralized network operation centers (NOCs) to execute firmware updates, perform cold restarts, and debug bios screens over secure HTTPS connections, bypassing the need for onsite staff.
Training modern AI models like DeepSeek demands continuous cluster operations across hundreds of GPU nodes. An unexpected failure in a single GPU memory module can interrupt the entire gradient step, wasting expensive computing cycles. Real-time telemetry monitoring systems intercept PCIe bus errors early, initiating dynamic workload migration before the host node suffers a kernel panic.
Liquid cooling is essential for modern rack servers running components at maximum capacity. Telemetry integrations monitor leak detection ropes, coolant inlet/outlet temperatures, and block pressure differentials. This data ensures any cooling loop failure triggers an automatic shutdown before liquid damage occurs.
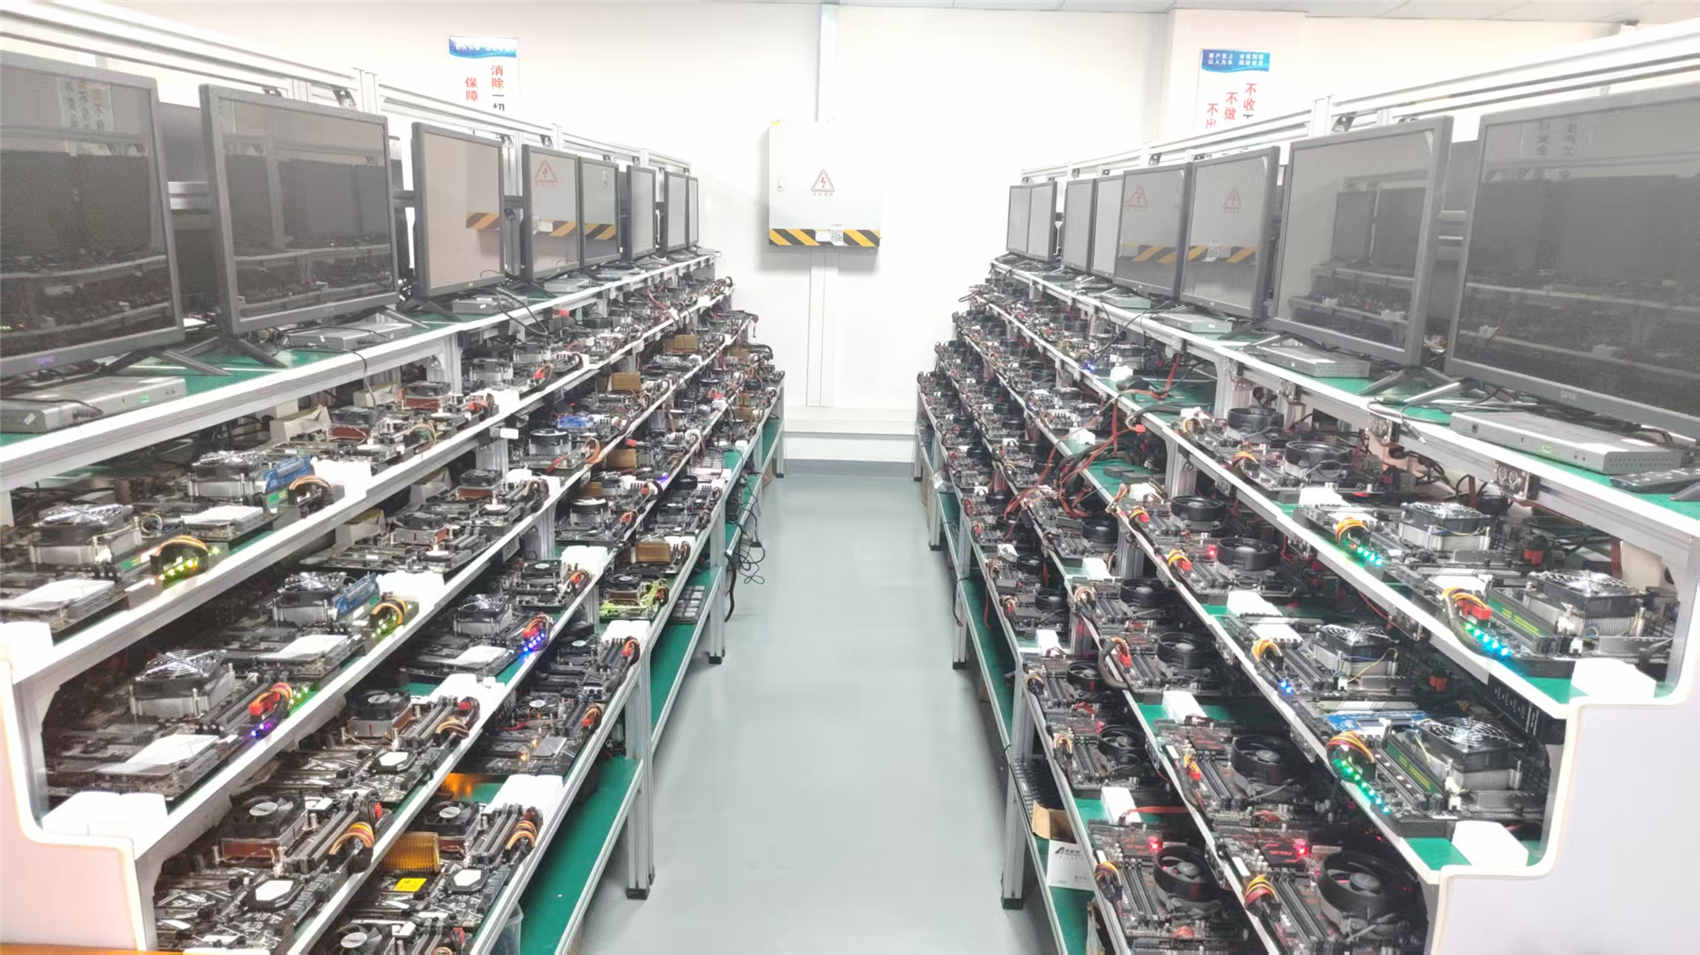
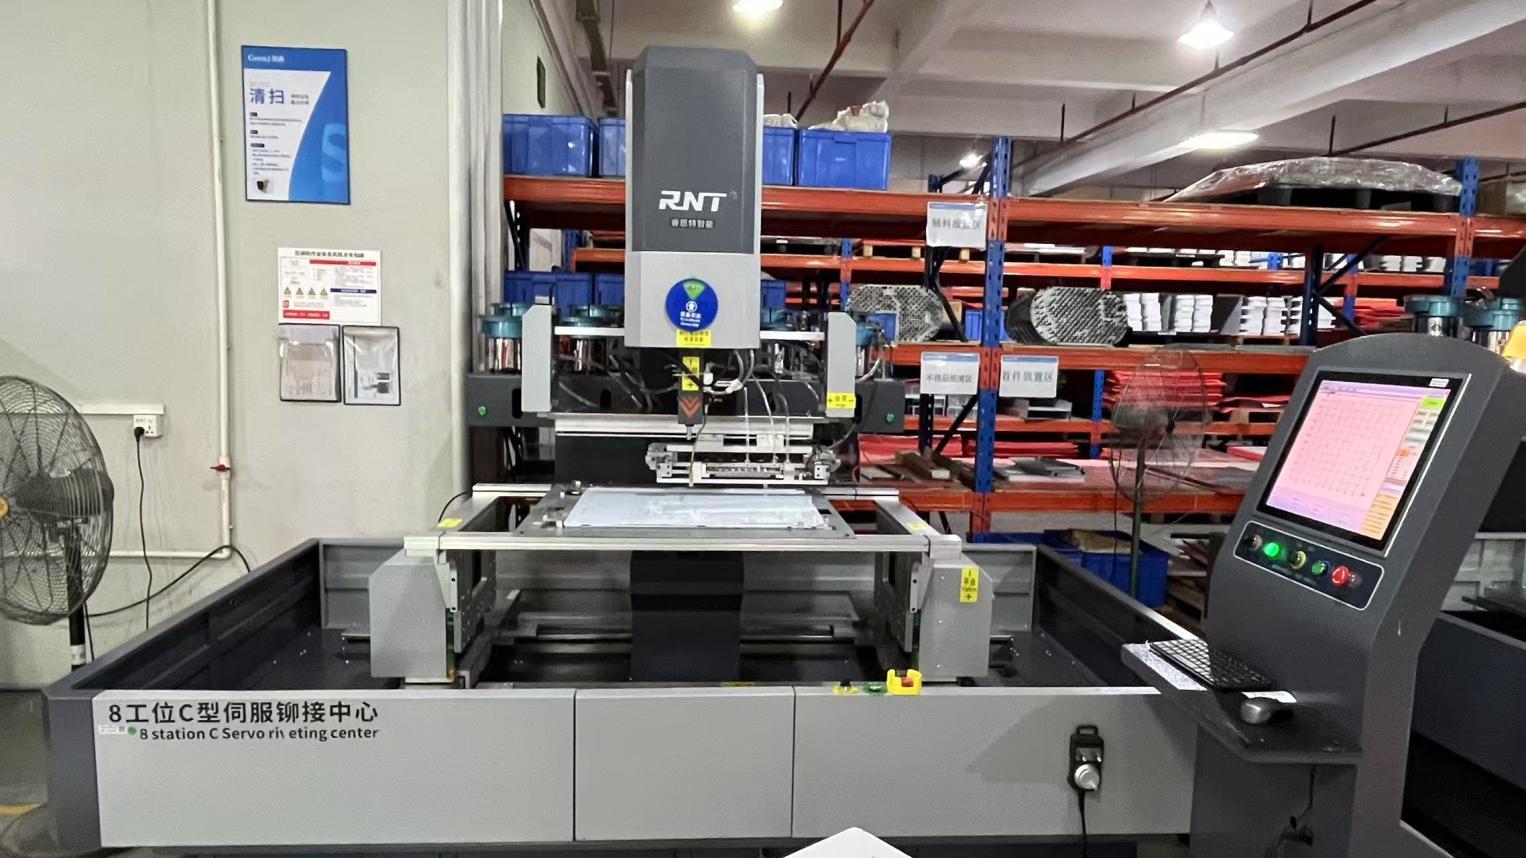
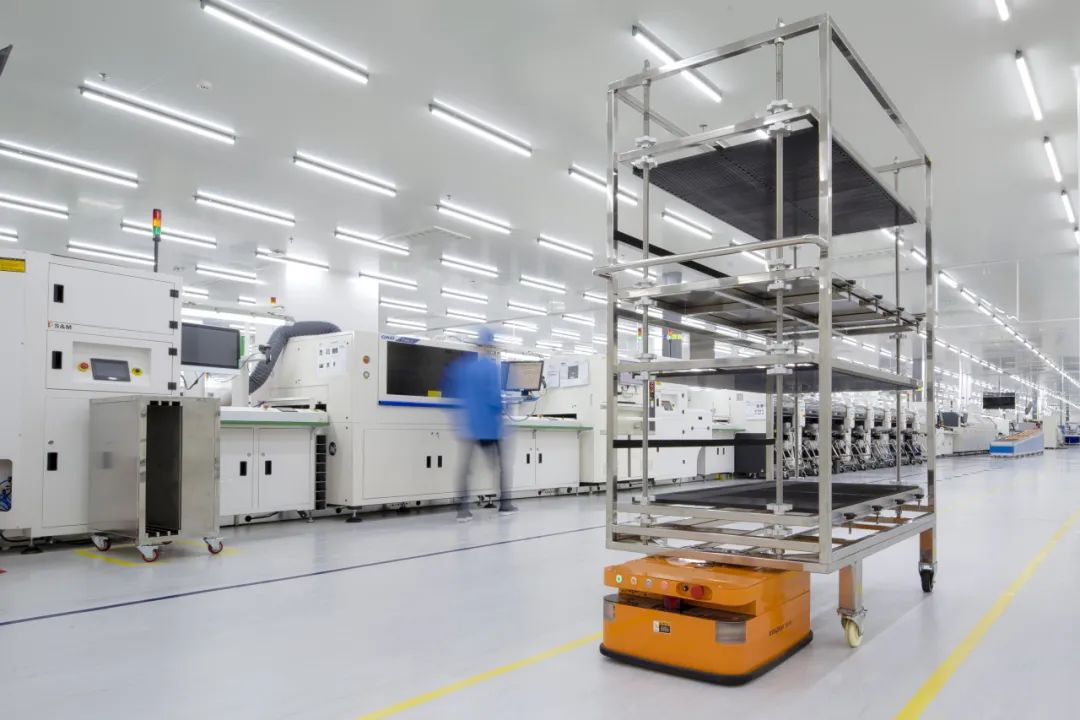
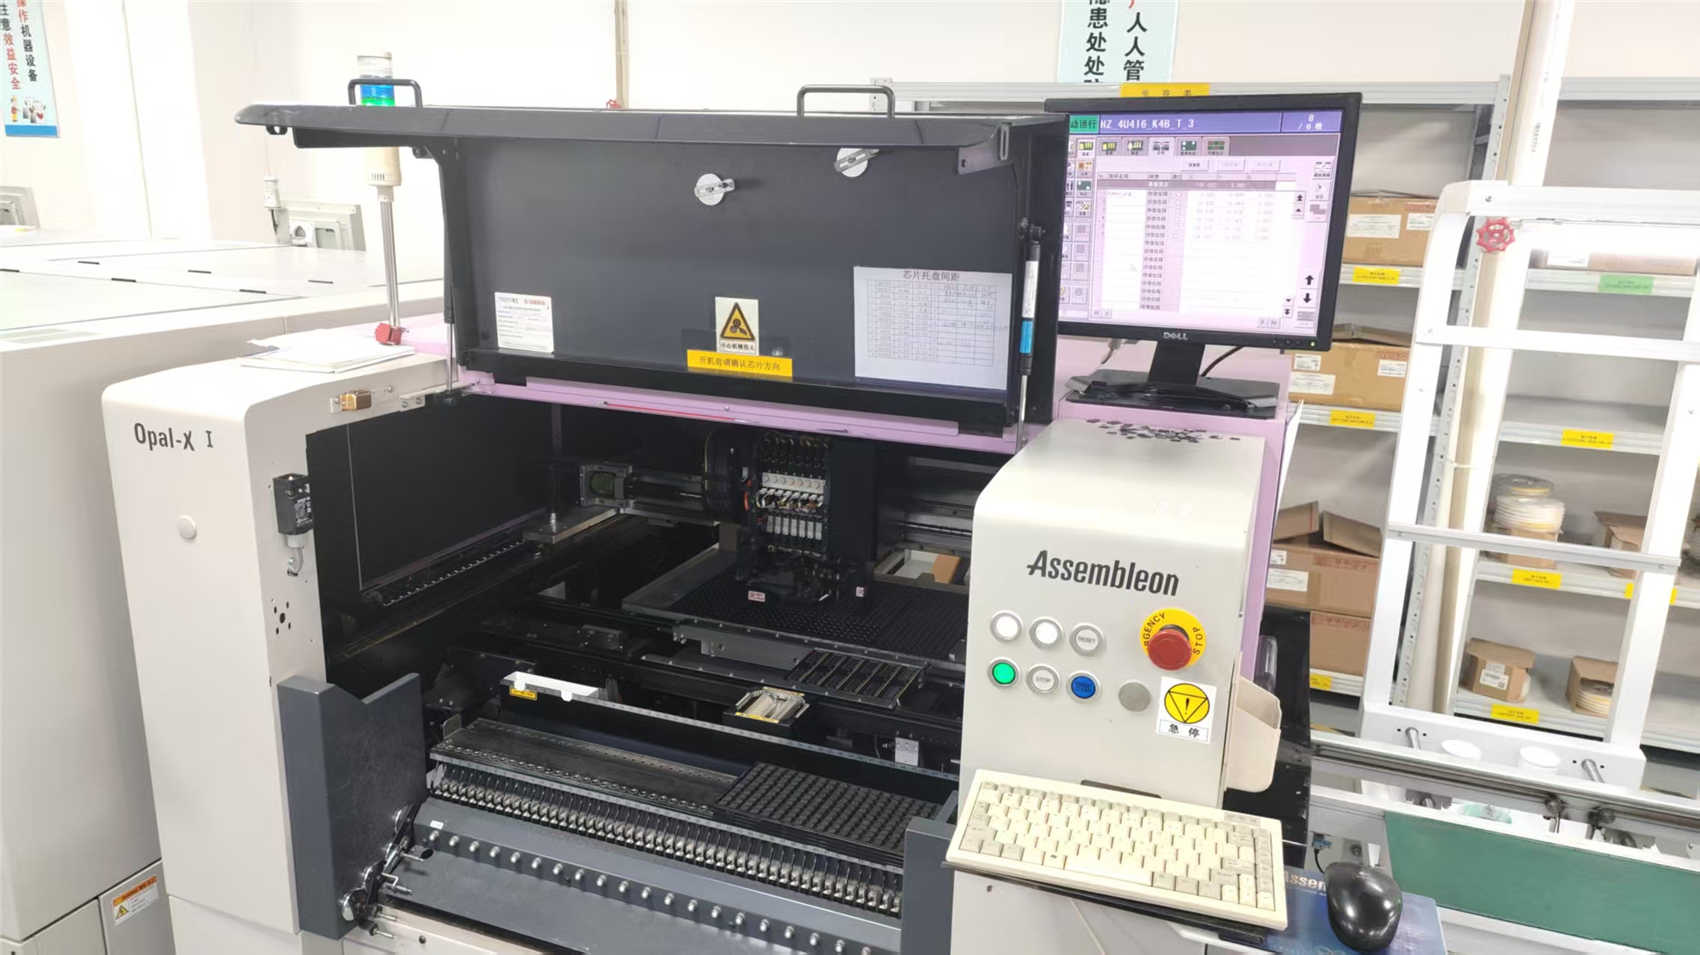
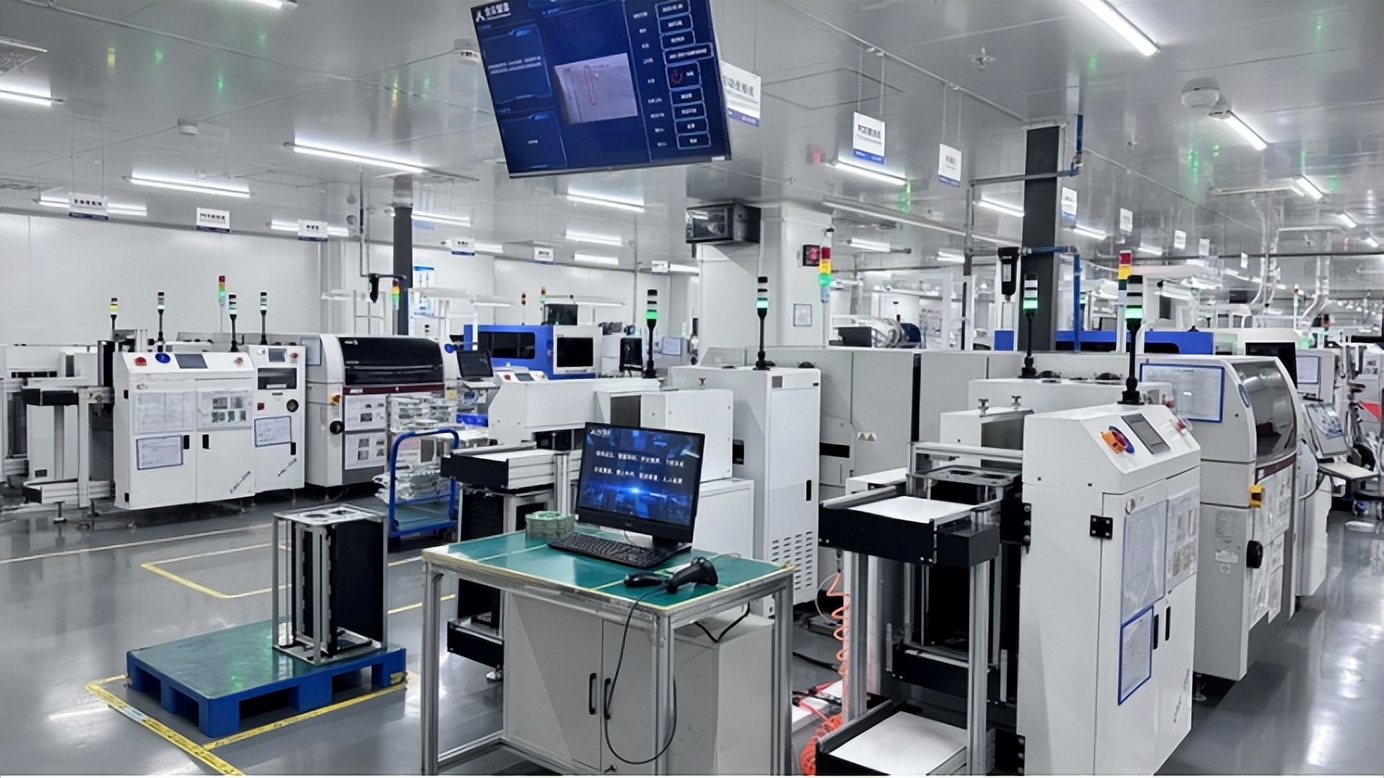
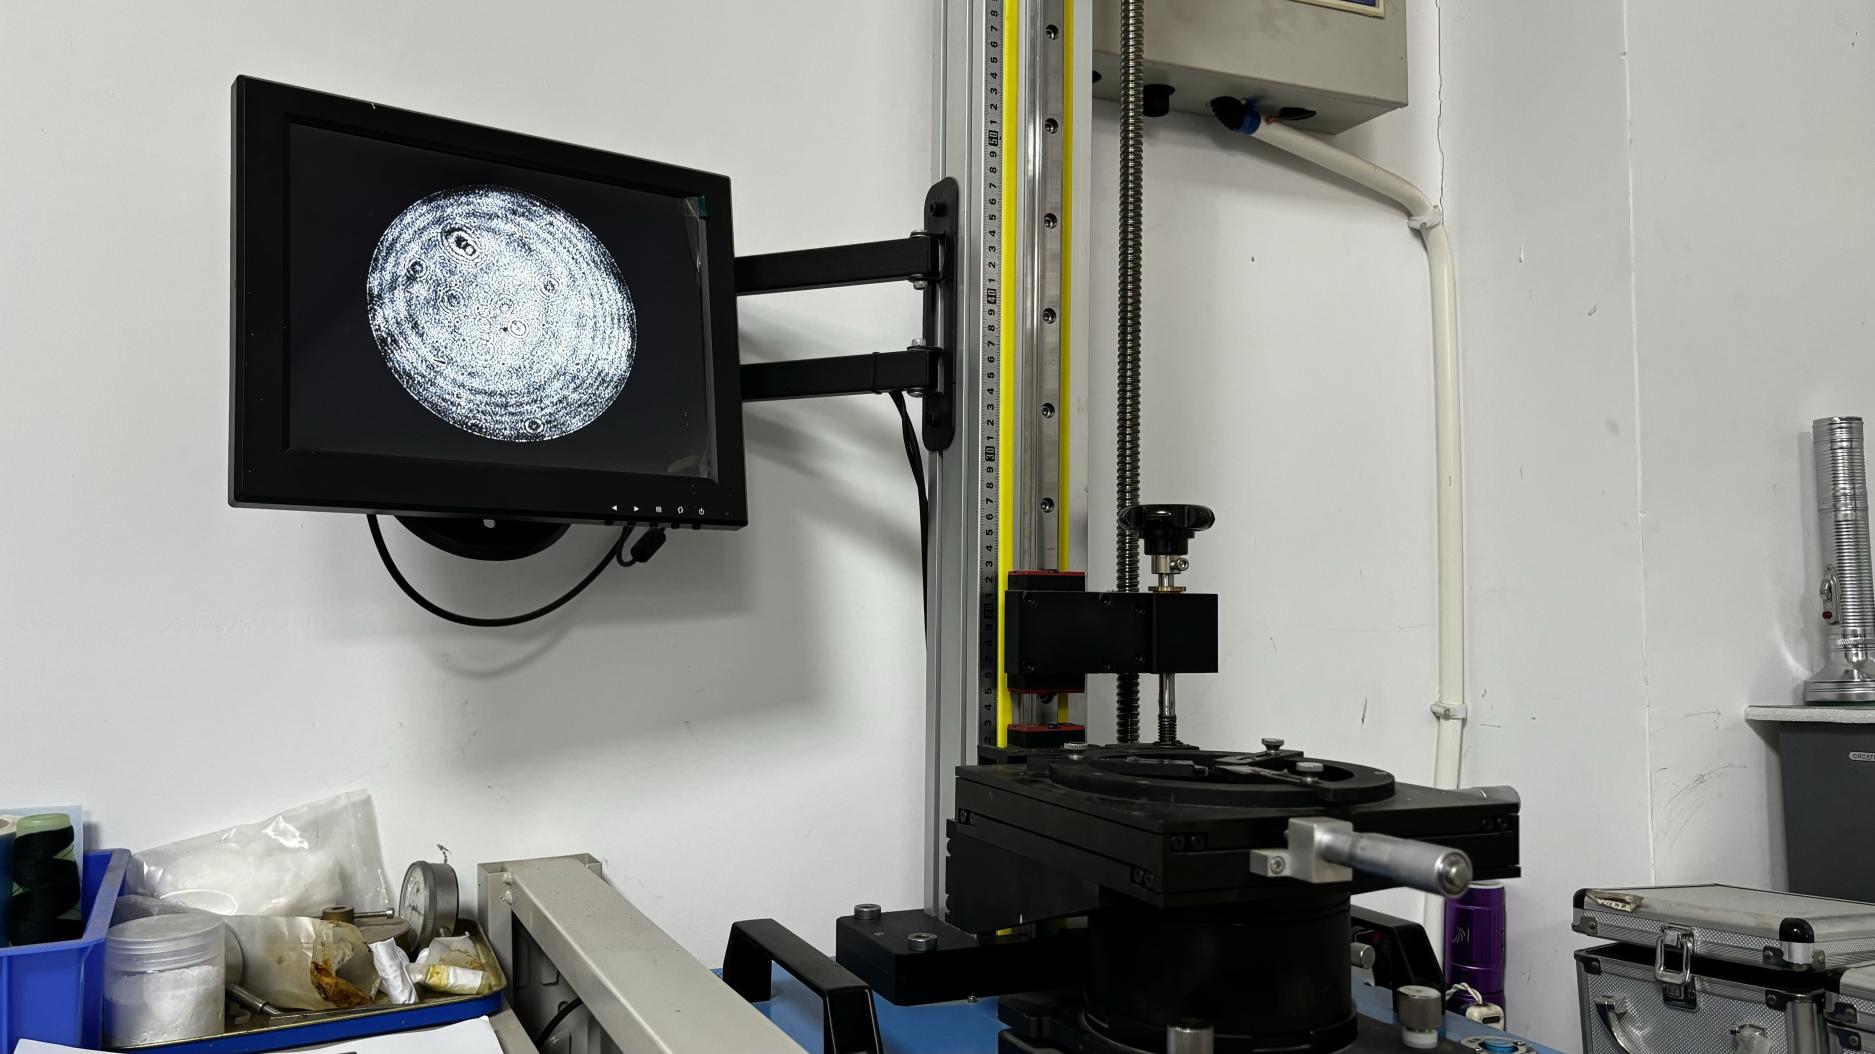
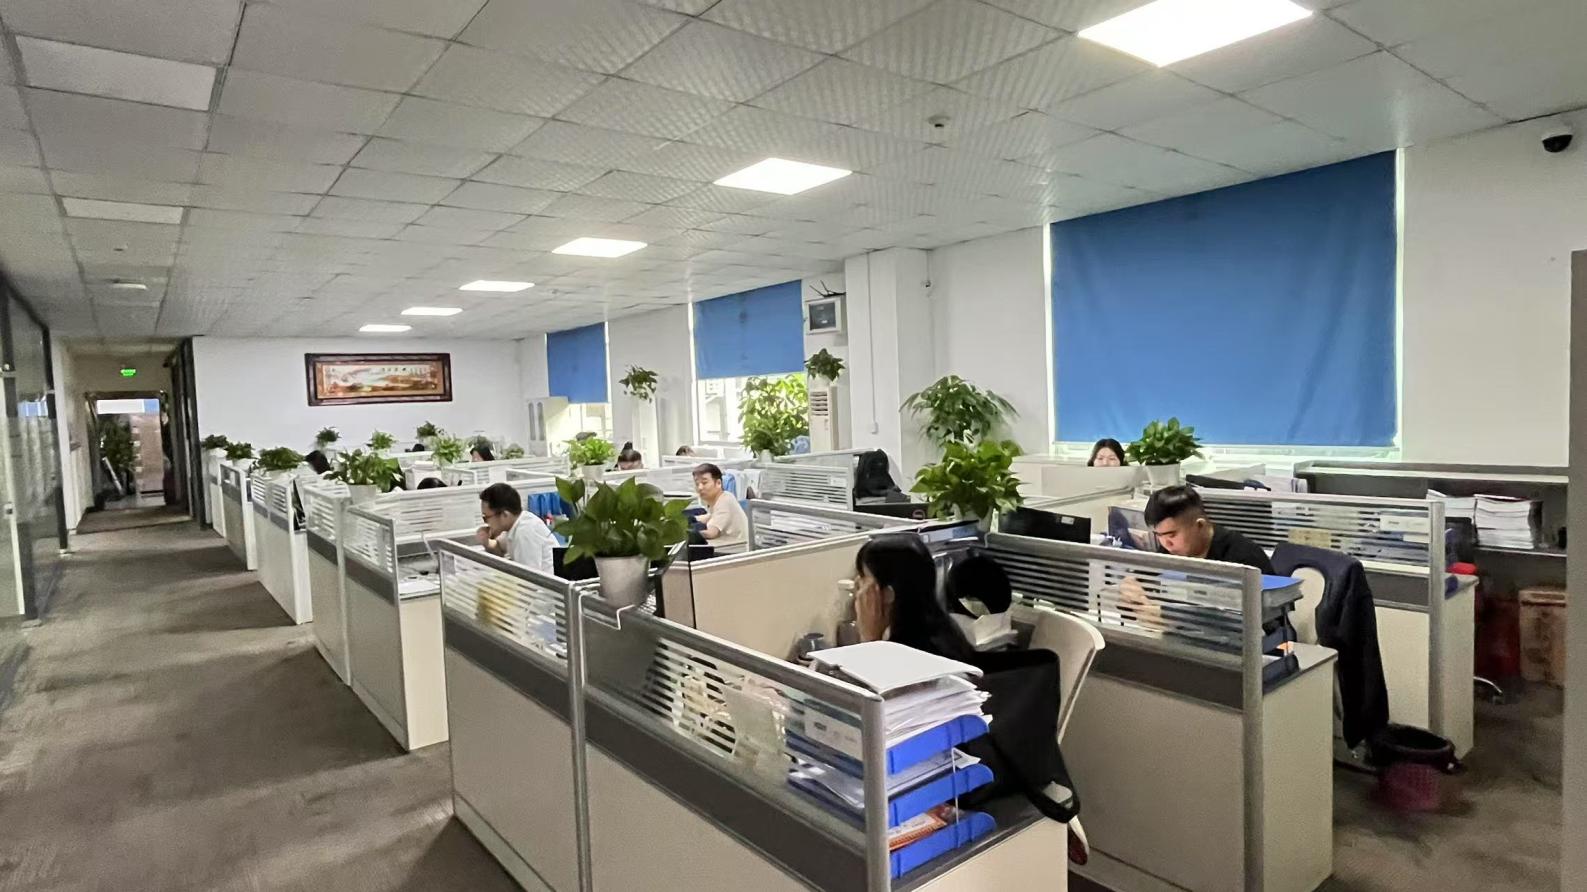
At our 18,600㎡ manufacturing facility, quality is a non-negotiable benchmark. We employ a strict 100% full inspection combined with random sampling reliability testing to ensure long-term stability and continuous operation under high-load workloads. Our experienced QA team consists of 45 quality professionals who monitor every step of the server assembly and testing process.
Our product inspection methods are designed to expose potential component defects before delivery: Burn-in testing, thermal stress testing, automated optical inspection (AOI), firmware validation, and full system AI workload simulation testing. By testing hardware under simulated extreme processing loads, we confirm that all sensor logs, fan curves, and diagnostic interfaces work correctly before export.

Bexora is continuously refining its hardware designs to anticipate the needs of next-generation infrastructure management. Our engineering roadmap focuses on three main developments:
We are transitioning all server profiles to comply with the latest DMTF Redfish standards. This allows monitoring tools to discover and configure hardware using simple JSON payloads over HTTPS, removing reliance on legacy, insecure IPMI utilities.
By implementing gRPC Network Management Interface (gNMI) capabilities on our latest BMC cards, we enable real-time telemetry streaming. Operators can subscribe to specific hardware states and receive immediate updates, avoiding the latency and overhead of traditional periodic polling.
Secure boot architectures demand monitoring at the lowest levels of hardware. Our systems build secure cryptoprocessors directly into the management loop, verifying BMC firmware integrity at boot and alerting administrators to any tampering attempts.